Explore Spend with Full Context
A self-service analytics module to analyze cost and usage trends across cloud, data, and AI workloads
How ANALYZER Works
ANALYZER watches your spend, finds anomalies, and tells you exactly what changed and what to do next.

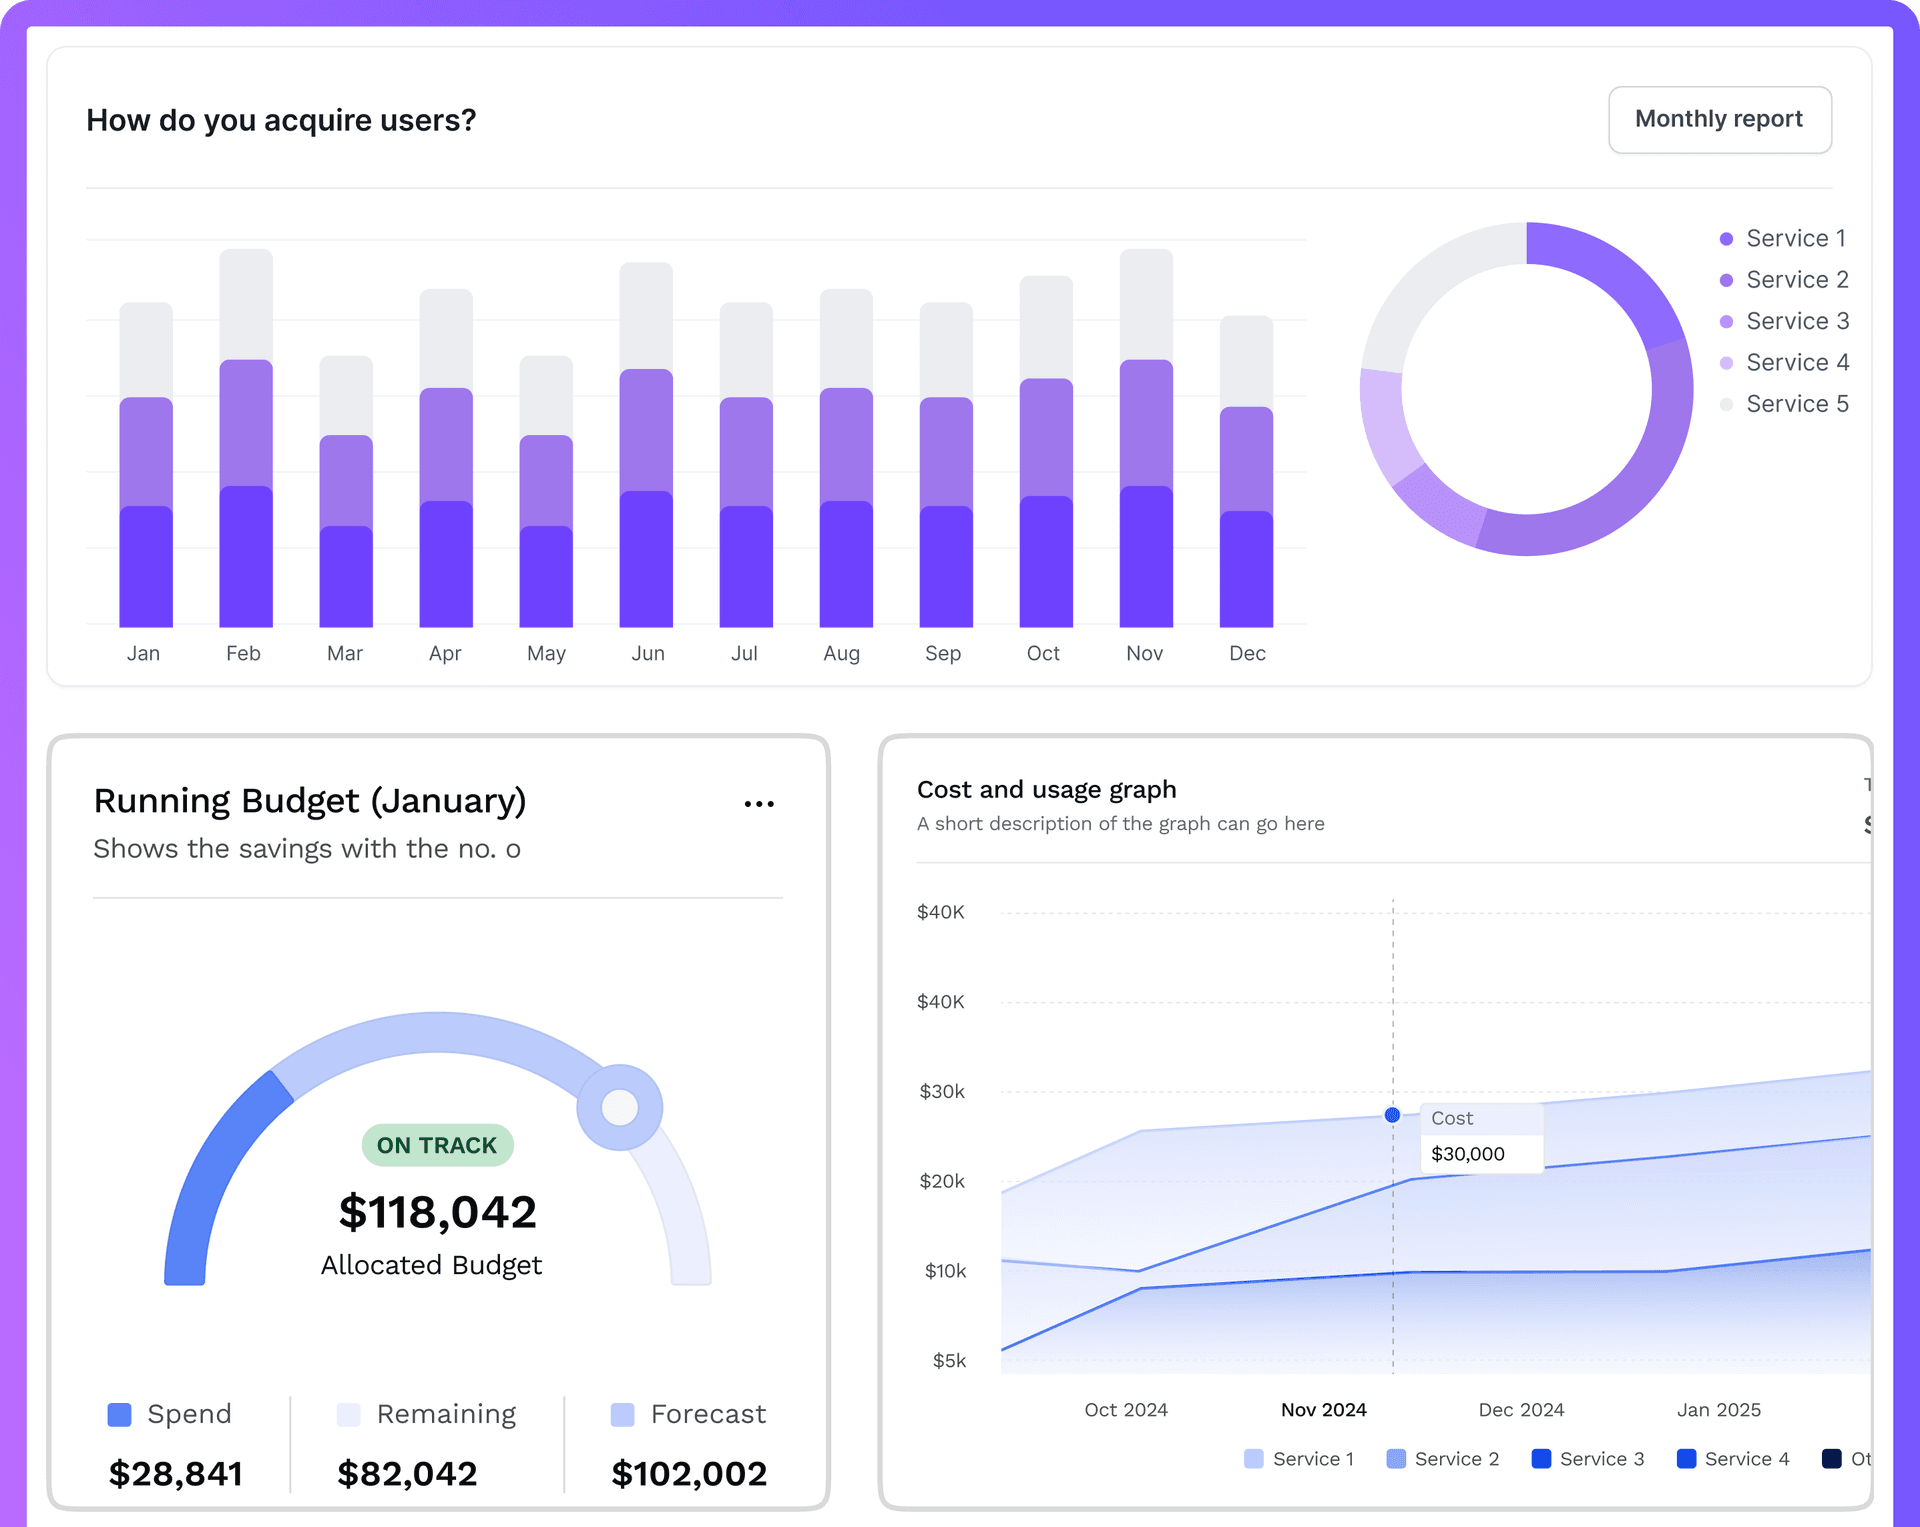
Trend analysis, any way
Explore cost and usage trends over time using flexible dimensions like cloud services, accounts, regions, and business units. Analyze spend from any angle without losing context or clarity.
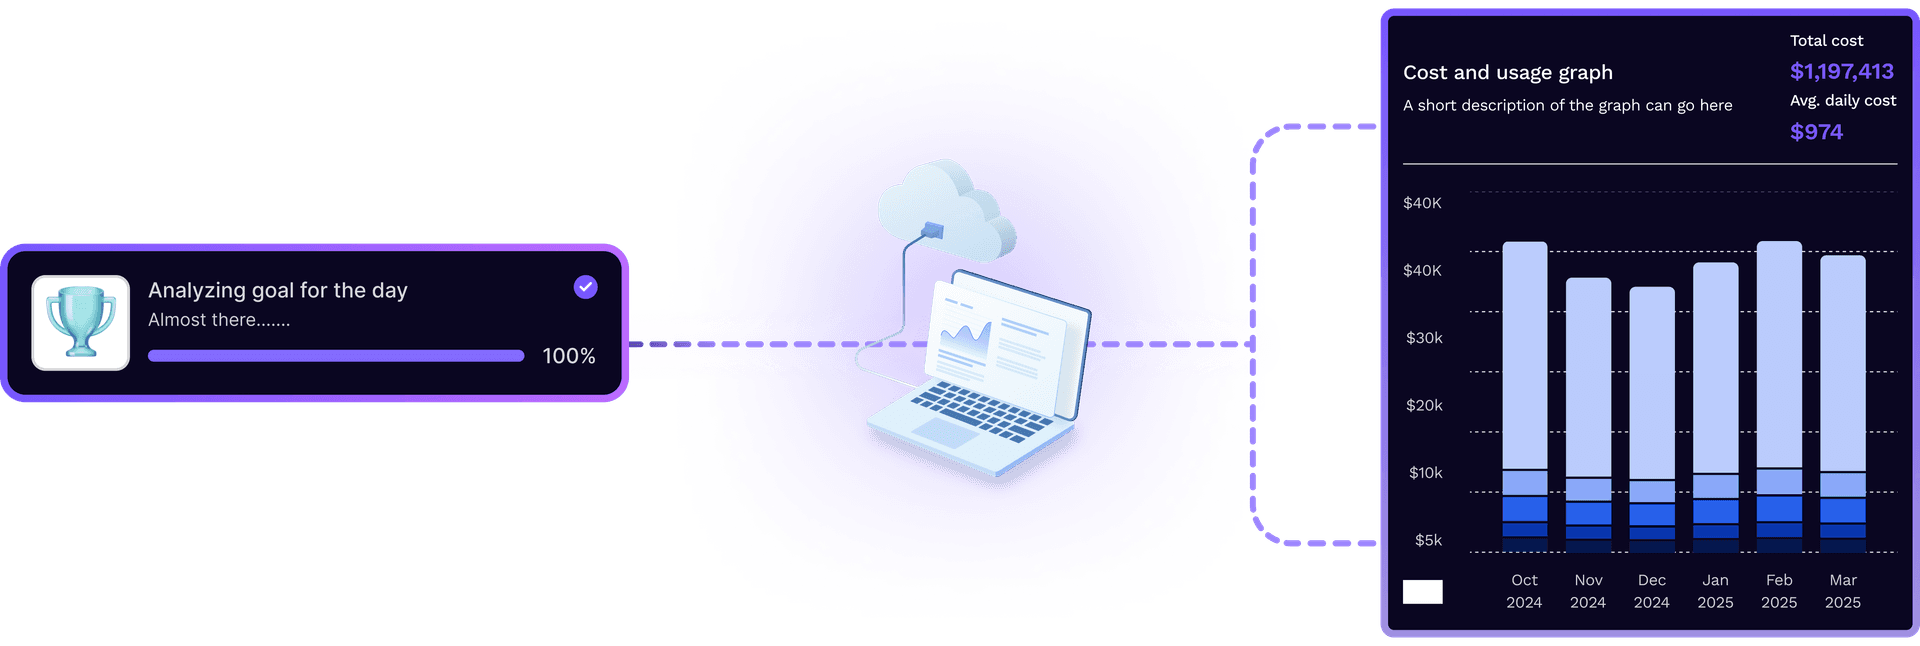
Diagnostics, simplified
Drill down from high-level trends to resource-level details in just a few clicks. Analyzer helps you identify anomalies, inefficient resources, and key cost drivers without complex queries.
Save, Schedule, and Share
Make insights repeatable and easy to share. Save views, schedule reports, and collaborate with teams to keep cost analysis consistent and automated across the organization.
Why ANALYZER Is Different
FinOpsly gives you real-time visibility and predictive insights to stop overruns before they happen.
Traditional Cost Analysis
FinOpsly Analyzer
Service- and account-centric views
Business-first analysis using custom dimensions like business units and unified tags
Static dashboards or fixed reports
Fully self-service exploration with flexible slicing and filtering
Hard to move from trends to root cause
Seamless drill-down from trends to resource-level diagnostics
Requires exports or SQL for deeper analysis
Deep diagnostics through an intuitive, no-code interface
Manual, ad-hoc reporting
Save, schedule, and share reports automatically
Built for FinOps specialists only
Simple enough for broad adoption, powerful enough for experts
Traditional Cost Analysis
Service- and account-centric views
Static dashboards or fixed reports
Hard to move from trends to root cause
Requires exports or SQL for deeper analysis
Manual, ad-hoc reporting
Built for FinOps specialists only
FinOpsly Analyzer
Business-first analysis using custom dimensions like business units and unified tags
Fully self-service exploration with flexible slicing and filtering
Seamless drill-down from trends to resource-level diagnostics
Deep diagnostics through an intuitive, no-code interface
Save, schedule, and share reports automatically
Simple enough for broad adoption, powerful enough for experts
Analyze Smarter. Act Faster.